Skills and Proficiencies
The methodology implemented for any NGS project depends on the data modality, the project design, and the hypotheses being tested. For the past five years I have worked extensively with RNA-sequencing data (single-cell, single-nuclei, spatial, long-read) and multiomic sequencing data (paired single-nuclei RNA-sequencing and ATAC-sequencing). Here, I summarize methods that highlight my expertise with NGS analysis, gathered over many different projects.
 Clustering
—
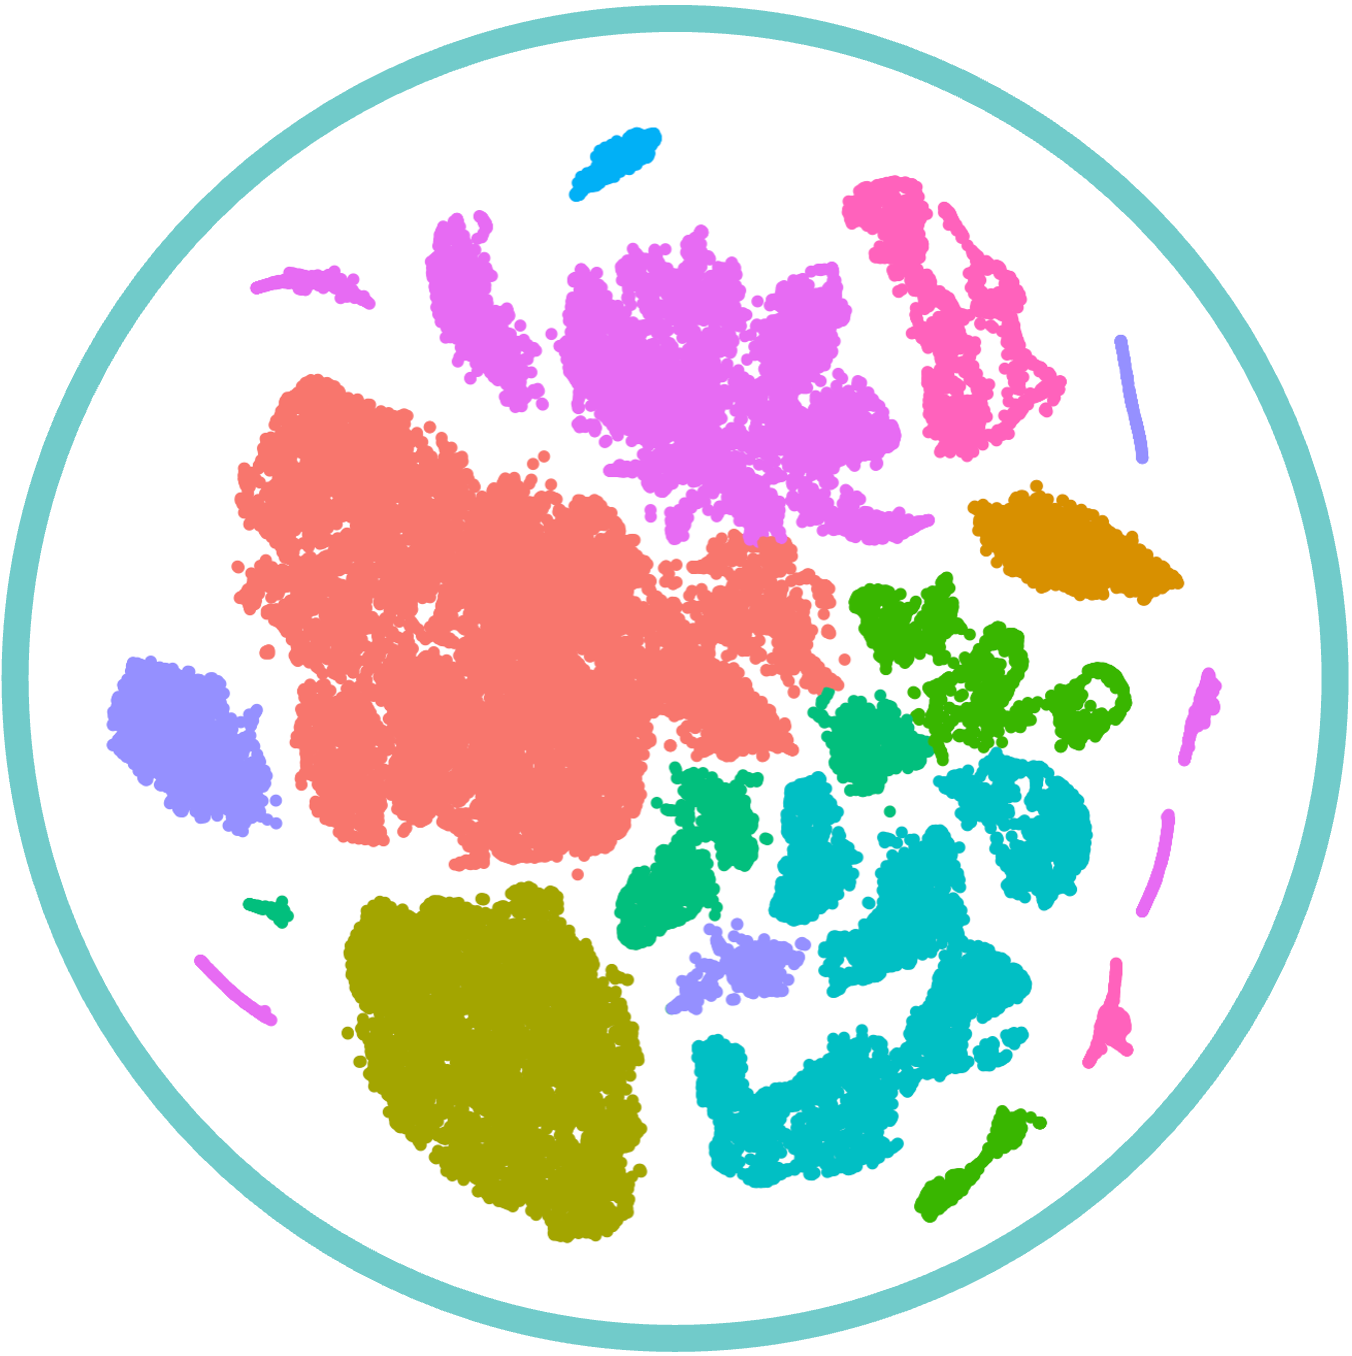
A primary goal of NGS analysis is the identification of biologically meaningful cell populations (e.g. cell types). This process almost always requires clustering analysis, although the method used depends on certain qualities of the NGS data. For single-cell and single-nuclei RNA-sequencing I have success with k-means clustering and graph-based clustering (Leiden, Louvain), depending on the complexity of the dataset. For spatial transcriptomics data, I have used several clustering methods that leverage the presence of known spatial locations (Banksy, BayesSpace, PRECAST).
Clustering
—
A primary goal of NGS analysis is the identification of biologically meaningful cell populations (e.g. cell types). This process almost always requires clustering analysis, although the method used depends on certain qualities of the NGS data. For single-cell and single-nuclei RNA-sequencing I have success with k-means clustering and graph-based clustering (Leiden, Louvain), depending on the complexity of the dataset. For spatial transcriptomics data, I have used several clustering methods that leverage the presence of known spatial locations (Banksy, BayesSpace, PRECAST).
 Integration
—
There are different motivations for integrating NGS data. Large sequencing studies are often sequenced in batches that introduce un-wanted technical variation that I have addressed with different tools that each have a unique statistical approach (Seurat, FastMNN, Harmony, scVI). I have integrated NGS data from different modalities or from different species through the subsequent use of label transfer (Seurat, scVI, NMF). A current priority in clinical research is to integrate genomic and transcriptomic sequencing. In the absence of paired genomic sequencing, I have leveraged GWAS data to estimate the relevance of gene sets to human disease (MAGMA, s-LDSC). With paired genomic data, I am currently performing eQTL analysis and to directly integrate genomic and transcriptomic information and to test causal association with mendelian randomization analysis.
Integration
—
There are different motivations for integrating NGS data. Large sequencing studies are often sequenced in batches that introduce un-wanted technical variation that I have addressed with different tools that each have a unique statistical approach (Seurat, FastMNN, Harmony, scVI). I have integrated NGS data from different modalities or from different species through the subsequent use of label transfer (Seurat, scVI, NMF). A current priority in clinical research is to integrate genomic and transcriptomic sequencing. In the absence of paired genomic sequencing, I have leveraged GWAS data to estimate the relevance of gene sets to human disease (MAGMA, s-LDSC). With paired genomic data, I am currently performing eQTL analysis and to directly integrate genomic and transcriptomic information and to test causal association with mendelian randomization analysis.
 Differential expression models
—
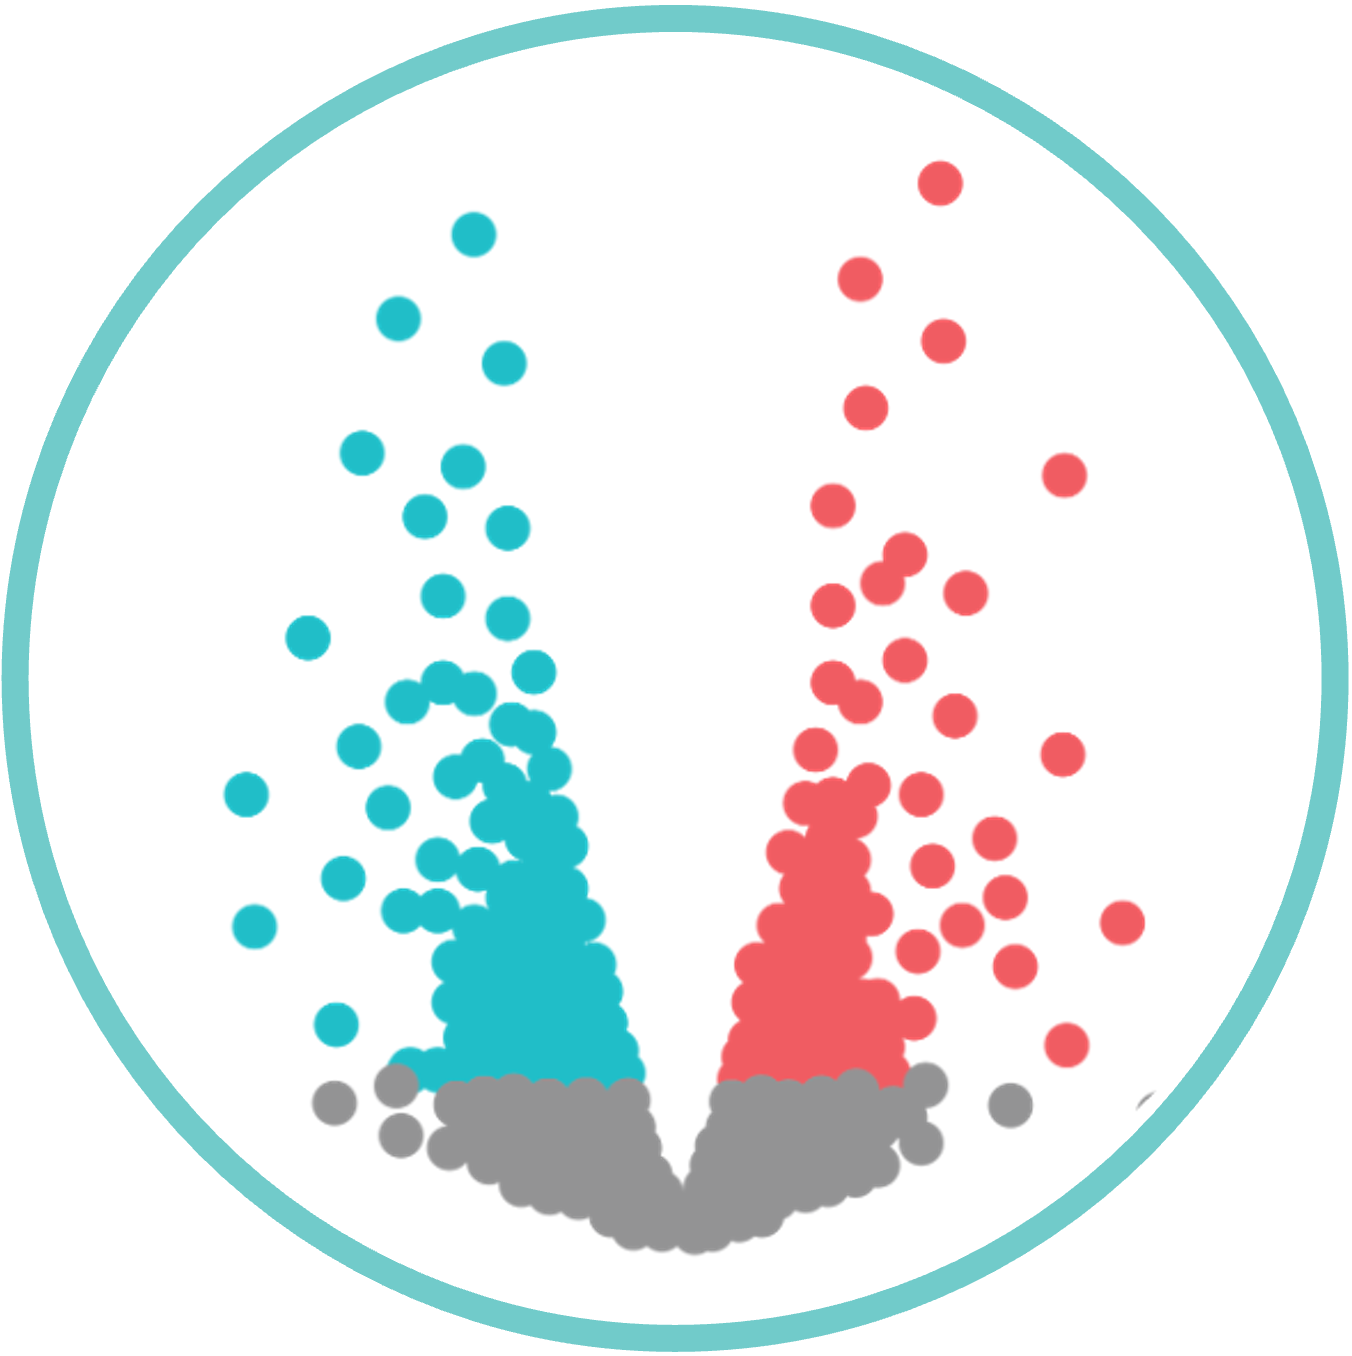
Differential expression (DE) modeling is fundamental to most hypothesis testing with NGS data and I have implemented both single-observation models for RNA-sequencing (MAST, Wilcoxon signed rank test) and pseudo-bulk observation models for RNA-sequencing and ATAC-sequencing (limma, edgeR, DESeq2). I have performed DE modeling for both simple and complex experimental designs, gaining both the experience and statistical expertise to navigate the many assumptions and considerations that make a critical difference when interpreting DE models.
Differential expression models
—
Differential expression (DE) modeling is fundamental to most hypothesis testing with NGS data and I have implemented both single-observation models for RNA-sequencing (MAST, Wilcoxon signed rank test) and pseudo-bulk observation models for RNA-sequencing and ATAC-sequencing (limma, edgeR, DESeq2). I have performed DE modeling for both simple and complex experimental designs, gaining both the experience and statistical expertise to navigate the many assumptions and considerations that make a critical difference when interpreting DE models.
 Gene sets and networks
—
I typically identify genes of interest through DE modeling and gene co-expression networks (hdWGCNA). I have used both gene set enrichment analysis (fgsea) and over-representation analysis (clusterProfiler, EnrichR) to extract biological information by querying a variety of annotation databases (GO, REACTOME, STRING). With transcriptomic data I have used gene regulatory network (GRN) analysis (SCENIC) to identify transcription factors that could explain NGS gene sets. With paired RNA-sequencing and ATAC-sequencing multiomic data more GRN analyses are possible (SCENIC+, Linger); I have also performed motif enrichment and peak-to-gene linkage analysis (ArchR, Signac).
Gene sets and networks
—
I typically identify genes of interest through DE modeling and gene co-expression networks (hdWGCNA). I have used both gene set enrichment analysis (fgsea) and over-representation analysis (clusterProfiler, EnrichR) to extract biological information by querying a variety of annotation databases (GO, REACTOME, STRING). With transcriptomic data I have used gene regulatory network (GRN) analysis (SCENIC) to identify transcription factors that could explain NGS gene sets. With paired RNA-sequencing and ATAC-sequencing multiomic data more GRN analyses are possible (SCENIC+, Linger); I have also performed motif enrichment and peak-to-gene linkage analysis (ArchR, Signac).
Working with NGS data requires extensive organization and documentation, often implemented in high-performance computing environments and achieved with tools like Github for version control and conda or pip package management. My experience with different sequencing techniques has given me the skills to be comfortable processing NGS data from fastq files, manually performing quality control, barcode extraction, read alignment, and read quantification. Across the years I have used R and Python extensively, executing code with bash scripts, Jupyter Notebook, and integrated development environments like RStudio and PyCharm. I have worked with all of the major NGS processing pipelines including BioConductor, Seurat, and scanpy workflows.